 blog
blog
At times, the stock market and the economy appear to speak different languages. In spring 2020, as the U.S. economy ground to a halt due to COVID-19, GDP plunged 31.4% annualized and unemployment soared to 14.7%. Yet, during the first half of 2020, the S&P 500 rebounded more than 20%, even as headlines remained bleak.
How can stocks rally while the economy stumbles? The answer lies in the inherently forward-looking nature of financial markets, which often anticipate recovery long before it appears in the headlines. Investors quickly shifted focus from the economic carnage to aggressive government responses, including central bank rate cuts, extraordinary liquidity measures, and massive fiscal stimulus programs. Markets anticipated a recovery before it appeared in the data.
Looking back, much of that optimism was validated: by late 2021; unemployment had fallen below 4% and growth had returned.
This gap between the market’s expectations and the economic present is a recurring theme. Markets routinely price in anticipated developments, including policy actions and sentiment shifts, long before the official data reflects a turnaround. Recognizing this dynamic can help investors maintain perspective through headline-driven volatility and stay focused on longer-term trends rather than short-term swings.
Markets Versus the Economy: Framing the Basics
The “economy” encompasses all productive activity in a given nation, reflected in numbers such as GDP, employment data, inflation, and consumer spending. Economists track these figures to measure the current health and momentum of growth. In contrast, financial markets are the venues where stocks, bonds, and currencies are traded, and they represent investors’ collective expectations for the future. Market swings can be rational, sometimes excessive, and occasionally reflect forces far removed from this year’s economic fundamentals.
This difference in “clocks” is a frequent source of confusion. Financial markets often turn higher when current economic data is at its worst and can falter even when headlines suggest strength. To better understand the pattern, consider a few historical examples.
Historical Examples: When Market Moves Defy Economic Reality
In the early 1980s, the U.S. endured a deep recession. Unemployment peaked at 10% and inflation ran persistently high. Nevertheless, from August 1982 onward, the market rallied sharply, preceding much real improvement in economic indicators. The change was triggered by expectations of Federal Reserve interest rate cuts and hopes of an economic turnaround.
Chart 1. S&P500 Index (base = 100, USD) Dec 31/1980 to Aug 31/1983
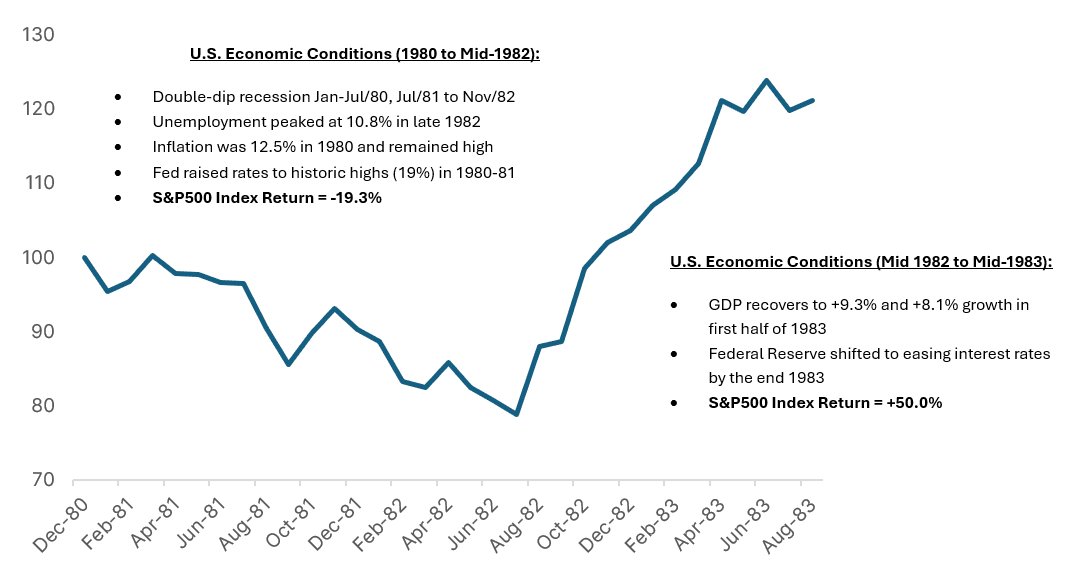
Sources and notes: LSEG, S&P500 Index monthly data in US dollars, before fees, transaction costs, taxes. Notes on U.S. Economic Conditions – Federal Reserve Board, LSEG, Bloomberg.
Another notable episode came in 2009 during the heart of the Great Recession. Even as unemployment continued rising and key economic indicators showed ongoing deterioration, the S&P 500 began a powerful bull run by March. Markets anticipated that extraordinary policy measures would mark the beginning of recovery, demonstrating once again that investors often act well ahead of the data.
Chart 2. S&P500 Index (base = 100, USD) Dec 31/2007 to June 30/2010
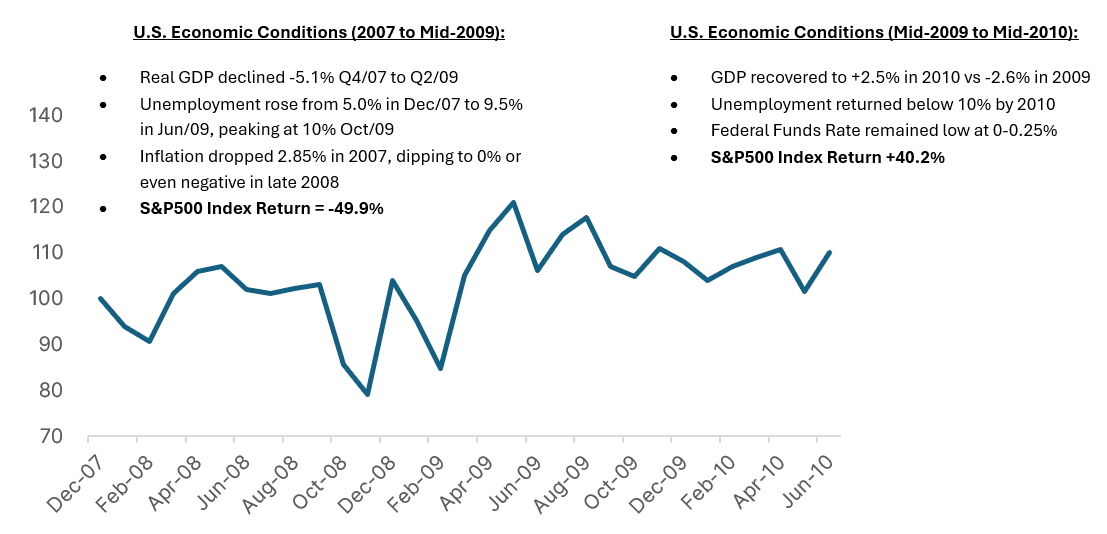
Sources and notes: LSEG, S&P500 Index monthly data in US dollars, before fees, transaction costs, taxes. Notes on U.S. Economic Conditions – Federal Reserve Board, LSEG, Bloomberg.
Canada is no stranger to this dynamic. In 2013, the S&P/TSX Composite Index advanced despite sluggish GDP growth and persistent unemployment. The rally was driven not by domestic economic strength, but by factors such as rising global commodity prices and optimistic international outlooks. This highlights a crucial point for Canadian investors: the TSX is shaped by sectors such as energy, resources, and financials that are deeply tied to global capital flows, sometimes diverging sharply from headlines about local economic growth.
Chart 3. S&PTSX Composite (base = 100, CAD) Dec 31/2012 to Dec 31/2013
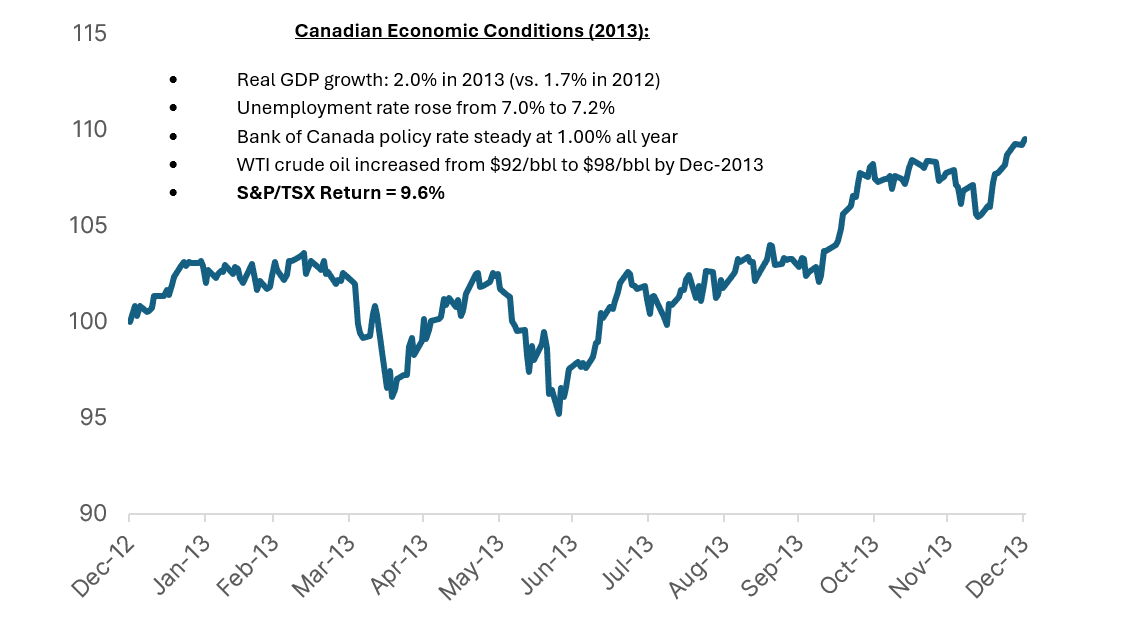
Sources and notes: LSEG, S&P/TSX Composite Index daily data in Canadian dollars, before fees, transaction costs, taxes. Notes on Canadian economic conditions sourced from Statistics Canada, Bank of Canada, LSEG.
These examples underscore a clear lesson: financial markets regularly lead the turning points in economic cycles. Waiting for economic data to fully improve before investing can result in missed opportunities, while staying attentive to the broader context, policy moves, and sentiment shifts gives investors a better shot at recognizing key inflection points.
Counterpoint – Sometimes the Market is a Coincident Indicator
While markets often anticipate economic shifts, they are not infallible predictors. Since 1953, the National Bureau of Economic Research (NBER) has declared 11 recessions in the United States, yet only eight of those recessions overlapped with a bear market in the S&P 500 Index, defined as a decline of 20% or more from its previous all-time high.
Looking closer, six of those eight bear markets led the start of the recession, with a median lead time of about nine months. However, the S&P 500 has not always been a reliable leading signal. On two notable occasions, July 1990 and February 2020, the downturn proved to be a coincident indicator, occurring at virtually the same time as the recession’s onset. The complete analysis is summarized in Table 1 below.
Table 1. U.S. Recessions, S&P500 Index Bear Markets
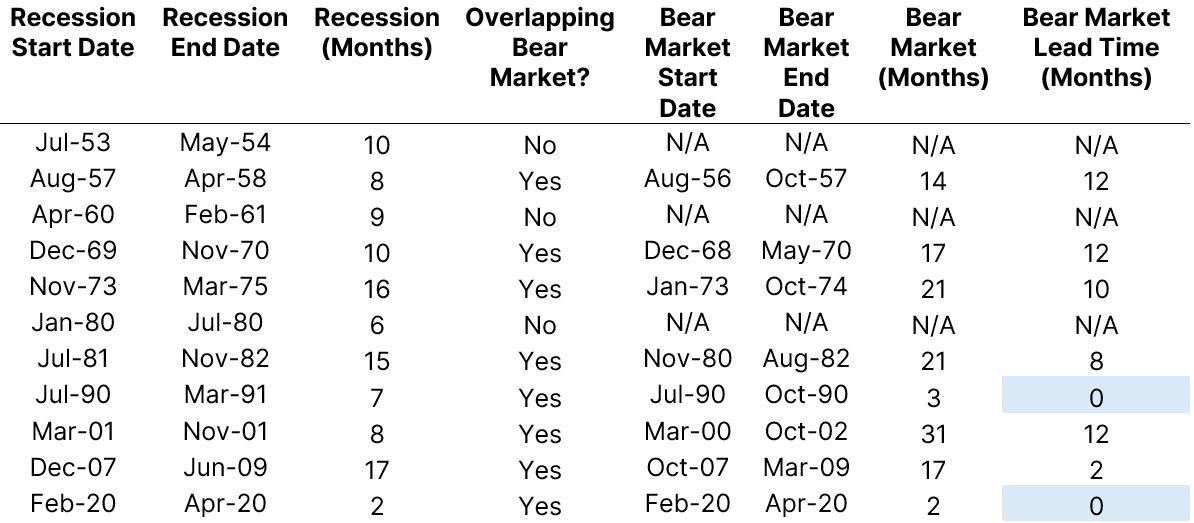
Sources and notes: National Bureau of Economic Research, LSEG. A bear market is when the S&P 500 or another major stock index falls by 20% or more from its recent high over a prolonged period of time. A recession is when the economy shrinks noticeably for several months, usually shown by less spending, fewer jobs, and lower overall output.
It is important to acknowledge that conclusions drawn from this data are limited by the relatively small number of recessions and overlapping bear markets in the historical record. Statistically, this modest sample size reduces the reliability of any definitive patterns or forecasting rules. The takeaway is that while the S&P 500 often anticipates economic contractions, it is not an infallible guide. At times it leads, other times it aligns, and forecasting macroeconomic outcomes based on market corrections remains a highly uncertain exercise at best.
Industry Differences – Markets vs the Economy
Understanding daily market moves requires grasping how a particular stock market index is constructed and the influence of sector trends.
In Canada, resource-linked sectors like energy and materials can have a major effect on both the S&P/TSX Composite Index (TSX) and the Canadian dollar. Price swings in oil or metals cause significant market volatility and impact national competitiveness. The sectors that dominate the TSX are not always those that drive jobs or GDP; for example, real estate and health care are key parts of the Canadian economy but have only a minor footprint in the index.
The composition of the TSX looks very different from Canada’s real economic foundation. Financials and energy are heavily represented in the Index, while sectors like real estate and health care have little weight. Meanwhile, GDP contributors such as industrials and consumer discretionary are under-represented in market indices, creating a disconnect between market moves and the broader economic reality.
For investors, this means interpreting market swings requires an understanding of what the TSX reflects, and what it leaves out before drawing conclusions about the overall Canadian economy.
Table 2. S&P/TSX Composite Index Sector Weights vs Canadian GDP by Sector
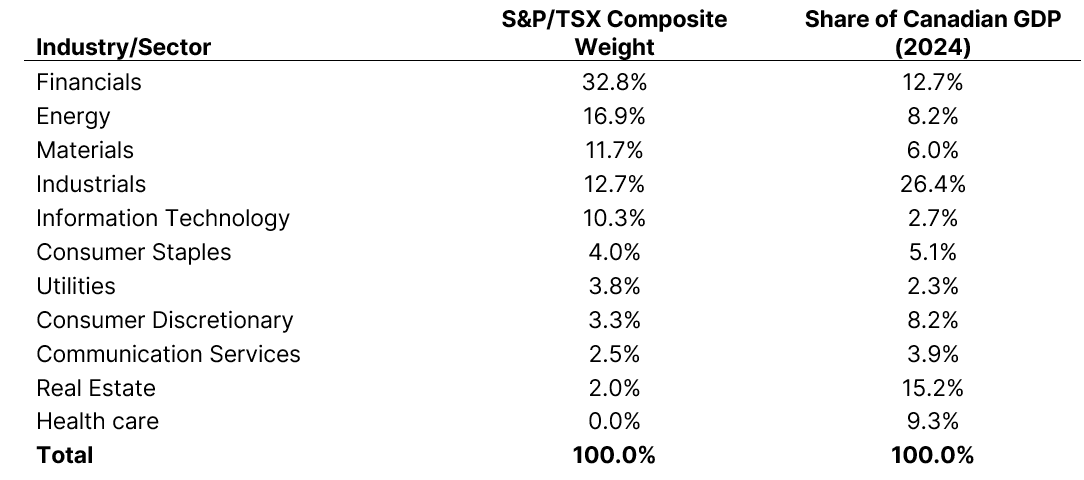
Sources and notes: S&P/TSX Composite weights as of Dec 31/24 (LSEG). 2024 Canadian GDP (Statistics Canada. Table 36-10-0434-03). Note that Gross domestic product (GDP) at basic prices, by industry, annual average (x 1,000,000), and excluding public sector contribution to GDP. Sector share (%) = (GDP from sector or industry / Total Canadian GDP) × 100. For each S&P/TSX sector, the equivalent or closest corresponding GDP industry was selected based on primary business activity or economic function.
In the United States, the S&P 500 Index sector makeup also diverges from the broader economy. Technology and communications account for over 40% of index weight, yet these areas are a comparatively small slice of U.S. GDP. Industrials, consumer staples, and real estate matter far more to the overall economy than their impact on index performance. The dominance of a handful of large U.S. technology companies that are global in scale means the S&P 500 Index often moves on the fortunes of those companies, even if trends elsewhere in the economy differ.
Table 3. S&P500 Index Sector Weights vs U.S. GDP by Sector
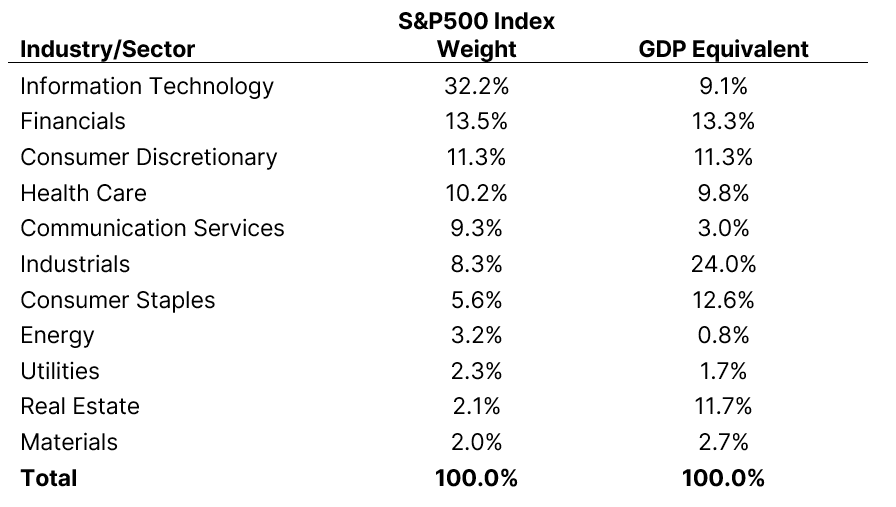
Sources and notes: S&P500 Index weights as of Dec 31/24 (LSEG). 2024 U.S. GDP (U.S. Bureau of Economic Analysis. Sector share (%) = (GDP from sector or industry / Total U.S. Private Industries GDP) × 100. For each S&P500 Index sector, the equivalent or closest corresponding GDP industry was selected based on primary business activity or economic function.
Lessons for Portfolio Construction
The mismatch between stock indices and economic output is not simply an academic detail. It has direct implications for investment strategy. Relying on broad indices as stand-ins for the whole economy and even basing an investment strategy on a top-down macroeconomic view can mislead analysis and drive portfolio concentration risk. A portfolio heavily tilted toward a single sector or region can expose investors to more severe losses if that area lags, underscoring the importance of diversification across sectors, regions and currencies. Over time, a broadly diversified portfolio offers a better chance at more stable returns, drawing from a wider range of market and economic forces.
Conclusion
Financial markets and the real economy can at times travel different paths and keep different schedules. Markets are built on expectations, taking cues from companies, policy, sentiment, and possible shifts long before economic data confirms changes are underway. For investors, maintaining perspective, discipline, and a diversified portfolio is key—lasting results are built on solid fundamentals, not necessarily economic headlines.